Fixing ‘Datastore Usage on Disk’ Alarms when using Virtual SAN Software
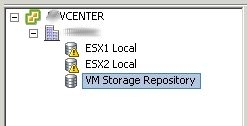
I was doing an upgrade from 4.0 to 4.1 this week on a two node cluster. This cluster is owned by an SMB and its a fully contained VMware setup, basically it has two DL380 G6 servers each with 8 – 146GB 10k SAS drives, dual Nehalem processors, and 24GB of ram. We have HP’s P4000 VSA software installed on each node to form a redundant two node SAN, so each server has all 8 drives in a RAID5 and a single VMware VMFS volume on them. Inside of that volume we have a single virtual machine (the VSA) and it consumes about 90% of the space in that datastore. Inside of the VSA is where all of the production VM’s live, but the problem is that the local datastores are in an alarm state because they are above the threshold set at the vcenter level. I suppose I could just change that threshold to like 98% or something and the alarms would go away, but that wouldn’t let us much time to react if the VSA volume ever got full. So the better solution would be to somehow ignore alarms on local datastores but still keep the alarms for shared datastores. Below is what the problem looks like… Local datastores are in an alarm state… but the “real” data which is in “VM Storage Repository” is not full yet.
Solution
After doing a little research I was able to come by one other blog post that used this same method on ESX to fix the errors on the service console volume, but I could not find anything related to local and VSA shared volumes. The process is the same for both though, so I figured I would share.
The first step is to log into vcenter (or esxi, whichever your using) and goto the Datastore Inventory tab. Next create two folders, one for local datastores and another for shared. Then drag your local datastores to the local folder and your shared datastores to the shared folder.
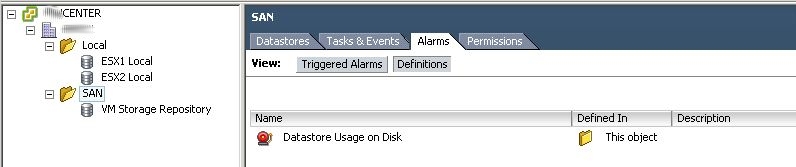
Note that the pictures shows how it will look after we delete some alarms and recreate them.
After putting your datastores in the proper folders click on the vcenter, or esxi object (whichever is the top level) and go to the alarms tab (you will need to click on the Definitions button as well. Find the ‘Datastore usage on disk’ alarm and go into it and take some screen shots of how it is setup, we will use these later to recreate the alrm, then delete it. (Or at least disable it) Then go down to the shared datastore folder that you created, and then into the alarms tab again (then click Definitions). In here we will want to recreate a ‘Datastore Usage on Disk’ alarm so that we still get alarms for our shared storage. Right click and Add new. and then refer to the screenshots you took in order to create it properly. Just for reference here is what it looks like inside of the alarm definition:
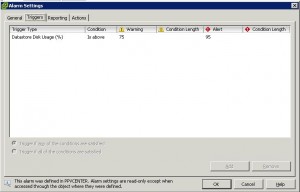
Now you should have something that looks like the last screen shot… you will have a ‘Datastore Usage on Disk’ alarm that has been created in “This object” and your local datastores are no longer monitored. If you wanted to you could create a disk usage alarm for the local folder and set its thresholds much higher just to be safe.
Configuring and Analysing vSphere Datastore Alarms
If there’s one thing that’s apparent when supporting vSphere environments, its that it’s never good news when a datastore has ran out of space. This article will look at how you can configure datastore alarms. Datastores can run out of space due to a number of reasons, the most common ones being snapshots and thin provisioning. The use of thin provisioning increases the possibility of oversubscribing storage at the datastore level.
There are a number of potential issues that can occur when a datastore is low on or out of space. These include virtual machine startup failure, vmotion failures, snapshot creation and commit failures and overall poor performance. This is where datastore alarms are extremely useful:

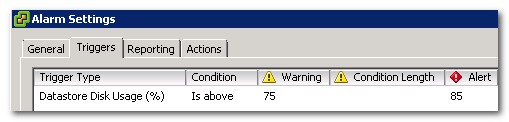
Datastore usage on disk alarms can be used to monitor the percentage of disk space usewd on each datastore in your vSphere environment. The default settings of the Datastore usage on disk alarm is to trigger a Warning when disk usage exceeds 75% and an Alert at 85%. These thresholds can be adjusted to suit the needs of your environment, although it is good practice to begin taking action as your arrays approach 80% utilized. This may vary depending on the size of your datastores and how they are being used.
We can see how the triggers are configured by viewing the alarm’s settings:
Along with the built in datastore alarms, custom alarms can be configured for datastores and datastore clusters.
Creating a Custom Datastore Alarm
The steps for creating a custom datastore alarms using the vSphere client are as follows:
- Go to the Datastores and Datastore Clusters view.
- Right-click the datastore to be monitored then click Alarm > Add Alarm. This will bring up the alarm’s settings screen.
- On the General tab enter a name for the alarm. For the Alarm Type, ensure that Datastore is selected and that Monitor for specific conditions or state and Enable this alarm are selected.
- On the Triggers tab, choose to trigger an alert if any or all of the conditions are met. Click Add. The Datastore Disk Usage Trigger will populate. Enter the desired settings for both Warnings and Alerts.
- On the Reporting tab, enter the desired settings for the Range and Frequency of the triggered alarm.
- On the Actions tab, choose to Send a notification email, Send a notification trap and/or Run a command. Once configuration is complete, click ok to save the custom alarm.
Working with and Analysing Datastore Alarms
The datastore usage alarm will send notifications when a datastore has exceeded it’s configured thresholds. To test this you can create a custom datastore usage alarm and set the thresholds to be along the lines of Warning when Datastore Disk Usage exceeds 10% and an Alert at 15%. On the datastore where I configured the alarm these thresholds were enough to generate a notification.
Where can you see these alerts?
Within the vSphere client you can see the alerts in a couple of places. The first is the vCenter Events screen, access from the Home screen:

The other is in the Datastores and Datastore Clusters view. We should see a red exclaimation mark over any datastore that has triggered an alert. Selecting the datastore and then the alarms tab will give detail about which alarm has triggered the alert or warning:

When you right click on a triggered alarm you get the option to clear the alarm or acknowledge it. If it is cleared then the alert will disappear, but will alert again depending on what its set in the alarm settings. For example, the default datastore usage alarm will trigger again if the thresholds are still exceeded after 5 minutes. Acknowledging the alarm won’t make it disappear, but it will become greyed out. This feature is to show that the alarm/fault is being worked on by an administrator. Clearing or acknowledging an alarm is treated as an event and is recorded in the vCenter events screen.
What can you do if a datastore is running out of space?
The most common remediation steps include:
- Increasing capacity by adding extents or extending the size of the LUN and VMFS volume.
- Use svMotion to move virtual machines to free up space
- Add additional datastores to migrate virtual machines to
- Delete unneeded snapshots on virtual machines on the datastore in question.
PowerCLI and Datastore Alarms
You can also list and interact with datastore alarms using PowerCLI. For example, to list the alarms in use for a particular datastore you can run:
get-datastore datastorename | get-alarmdefinition | select name,description | ft -auto
Анализ производительности ВМ в VMware vSphere. Часть 3: Storage
Сегодня разберем метрики дисковой подсистемы в vSphere. Проблема со стораджем – самая частая причина медленной работы виртуальной машины. Если в случаях с CPU и RAM траблшутинг заканчивается на уровне гипервизора, то при проблемах с диском, возможно, придется разбираться с сетью передачи данных и СХД.
Тему буду разбирать на примере блочного доступа к СХД, хотя при файловом доступе счетчики примерно те же.
Немного теории
Когда говорят о производительности дисковой подсистемы виртуальных машин, обычно обращают внимание на три связанных друг с другом параметра:
- количество операций ввода/вывода (Input/Output Operations Per Second, IOPS);
- пропускную способность (Throughput);
- задержку операций ввода/вывода (Latency).
Пропускная способность важна для нагрузок последовательного характера: доступ к блокам, расположенным друг за другом. Например, такую нагрузку могут генерировать файловые сервера (но не всегда) и системы видеонаблюдения.
Пропускная способность связана с количеством операций ввода/вывода следующим образом:
Throughput = IOPS * Block size, где Block size – это размер блока.
Размер блока является довольно важной характеристикой. Современные версии ESXi пропускают блоки размером до 32 767 КБ. Если блок еще больше, он делится на несколько. Не все СХД могут эффективно работать с такими большими блоками, поэтому в Advanced Settings ESXi есть параметр DiskMaxIOSize. С помощью него можно уменьшить максимальный размер блока, пропускаемого гипервизором (подробнее здесь). Рекомендую перед изменением данного параметра проконсультироваться с производителем СХД или хотя бы протестировать изменения на лабораторном стенде.
Большой размер блока может пагубно сказываться на производительности СХД. Даже если количество IOPS и throughput относительно невелики, при большом размере блока могут наблюдаться высокие задержки. Поэтому обращайте внимание на этот параметр.
Latency – самый интересный параметр производительности. Задержка операций ввода/вывода для виртуальной машины складывается из:
- задержки внутри гипервизора (KAVG, Average Kernel MilliSec/Read);
- задержки, которую дают сеть передачи данных и СХД (DAVG, Average Driver MilliSec/Command).
GAVG и DAVG измеряются, а KAVG рассчитывается: GAVG–DAVG.

Источник
Остановимся подробнее на KAVG. При нормальной работе KAVG должен стремиться к нулю или, по крайней мере, быть сильно меньше, чем DAVG. Единственный известный мне случай, когда KAVG ожидаемо высокий, – ограничение по IOPS на диске ВМ. В таком случае при попытке превышения лимита будет расти KAVG.
Самой значительной составляющей KAVG является QAVG – время в очереди на обработку внутри гипервизора. Остальные составляющие KAVG пренебрежимо малы.
Очередь в драйвере дискового адаптера и очереди к лунам имеет фиксированный размер. Для высоконагруженных сред данный размер бывает полезно увеличить. Здесь описано, как увеличить очереди в драйвере адаптера (одновременно увеличится очередь к лунам). Данная настройка работает, когда с луном работает только одна ВМ, что бывает редко. Если на луне несколько ВМ, необходимо также увеличить параметр Disk.SchedNumReqOutstanding (инструкция здесь). Увеличив очередь, вы уменьшаете QAVG и KAVG соответственно.
Но, опять же, сначала ознакомьтесь с документацией от вендора HBA и протестируйте изменения на лабораторном стенде.
На размер очереди к луну может влиять включение механизма SIOC (Storage I/O Control). Он обеспечивает равномерный доступ к луну со стороны всех серверов кластера за счет динамического изменения очереди к луну на серверах. То есть, если на каком-то из хостов работает ВМ, которая требует непропорционально много производительности (noisy neighbor VM), SIOC уменьшает длину очереди к луну на данном хосте (DQLEN). Подробнее здесь.
С KAVG разобрались, теперь немного о DAVG. Тут все просто: DAVG – это задержка, которую вносит внешняя среда (сеть передачи данных и СХД). В любой современной и не очень СХД есть свои счетчики производительности. Для анализа проблем с DAVG имеет смысл смотреть на них. Если же со стороны ESXi и СХД все нормально, проверяйте сеть передачи данных.
Чтобы не было проблем с производительностью, выбирайте правильную Path Selection Policy (PSP) для вашей СХД. Практически все современные СХД поддерживают PSP Round-Robin (с ALUA, Asymmetric Logical Unit Access, или без). Данная политика позволяет использовать все доступные пути к СХД. В случае с ALUA используются только пути до контроллера, который владеет луном. Не для всех СХД на ESXi есть дефолтные правила, которые устанавливают политику Round-Robin. Если для вашего СХД правила нет, используйте плагин от производителя СХД, который создаст соответствующее правило на всех хостах кластера, или создайте правило самостоятельно. Подробности здесь.
Также часть производителей СХД рекомендуют менять количество IOPS на путь со стандартного значения 1000 на 1. В нашей практике это позволяло «выжать» из СХД больше производительности и значительно сократить время, которое требуется на failover в случае выхода из строя или обновления контроллеров. Сверьтесь с рекомендациями вендора, и если противопоказаний нет, то попробуйте изменить данный параметр. Подробности здесь.
Основные счетчики производительности дисковой подсистемы виртуальной машины
Счетчики производительности дисковой подсистемы в vCenter собраны в разделах Datastore, Disk, Virtual Disk:

В разделе Datastore находятся метрики по дисковым хранилищам vSphere (датасторам), на которых лежат диски ВМ. Здесь вы найдете стандартные счетчики по:
- IOPS’ам (Average read/write requests per second),
- пропускной способности (Read/Write rate),
- задержкам (Read/Write/Highest latency).
В разделе Disk находятся метрики по блочным устройствам, которые используются ВМ. Тут есть счетчики по IOPS типа summation (количество операций ввода/вывода за период измерения) и несколько счетчиков, относящихся к блочному доступу (Commands aborted, Bus resets). Данную информацию, на мой взгляд, также удобнее смотреть в ESXTOP.
Раздел Virtual Disk – самый полезный с точки зрения поиска проблем производительности дисковой подсистемы ВМ. Здесь можно посмотреть производительность по каждому виртуальному диску. Именно эта информация нужна, чтобы понять, есть ли проблема у конкретной виртуальной машины. Помимо стандартных счетчиков количества операций ввода/вывода, объема чтения/записи и задержек, в данном разделе присутствуют полезные счетчики, которые показывают размер блока: Read/Write request size.
На картинке ниже график производительности диска ВМ, на котором можно увидеть количество IOPS, задержки и размер блока.

Также метрики производительности можно посмотреть по всему датастору, если включен SIOC. Здесь представлена базовая информация по средней Latency и IOPS’ам. По умолчанию данную информацию можно посмотреть только в реальном времени.

ESXTOP
В ESXTOP несколько экранов, на которых представлена информация по дисковой подсистеме хоста в целом, отдельным виртуальным машинам и их дискам.
Начнем с информации по виртуальным машинам. Экран “Disk VM” вызывается клавишей “v”:

NVDISK – это количество дисков ВМ. Чтобы посмотреть информацию по каждому диску, нажмите “e” и введите GID интересующей ВМ.
Значение остальных параметров на данном экране понятно из их названий.
Еще один полезный при поиске проблем экран – Disk adapter. Вызывается клавишей “d” (на картинке ниже выбраны поля A,B,C,D,E,G):

NPTH – количество путей к лунам, которые видны с данного адаптера. Чтобы получить информацию по каждому пути на адаптере, нажмите “e” и введите название адаптера:

AQLEN – максимальный размер очереди на адаптере.
Также на этом экране представлены счетчики задержек, о которых я рассказывал выше: KAVG/cmd, GAVG/cmd, DAVG/cmd, QAVG/cmd.
На экране Disk device, который вызывается клавишей “u”, представлена информация по отдельным блочным устройствам – лунам (на картинке ниже выбраны поля A, B, F, G, I). Здесь можно увидеть состояние очереди к лунам.

DQLEN – размер очереди для блочного устройства.
ACTV – количество команд ввода/вывода в ядре ESXi.
QUED – количество команд ввода/вывода в очереди.
%USD – ACTV / DQLEN × 100%.
LOAD – (ACTV + QUED) / DQLEN.
Если %USD высокий, стоит рассмотреть возможность увеличения очереди. Чем больше команд в очереди, тем выше QAVG и, соответственно, KAVG.
Также на экране Disk device можно посмотреть, работает ли на СХД VAAI (vStorage API for Array Integration). Для этого нужно выбрать поля A и O.
Механизм VAAI позволяет перенести часть работы из гипервизора непосредственно на СХД, например, зануление, копирование блоков или блокировки.

Как видно на картинке выше, на данной СХД VAAI работает: активно используются примитивы Zero и ATS.
Fixing Datastore Alarms, changing hard drive provisioning
I don’t have much experience using VMware or managing datastores. We have a concern about our datastores that I believe should be addressed, and hopefully fixed without too much repercussion.
Basically we have 4 datastores that are throwing alarms «Datastore usage on disk». The VM’s on these datastores are provisioned either thick lazy zeroed or thin provisioning.
I am attaching a screenshot of the VMs and Templates list and the triggered alarms these VM’s/Datastores are throwing.
I’d also like to better understand provisioning and best practices for my VM’s going forward. I’ve read the basic description of the different types, but I guess I need a more layman’s explanation of how it works.

Popular Topics in VMware
7 Replies

Datastore Usage on Disk is an alarm that is triggered when you have X% of your datstore’s storage capacity used. You can essentially do one of two things: either increase the threshold percentage for this warning (or turn the alarm off completely), or you can lighten the load on your datastores.
Within the vSphere Client click on your top-level vCenter name in the left pane, and then click on the Alarms tab. Click on Definitions and then find the alarm definition. Right click on it and click Edit Settings. Click on the Triggers tab. Then from there you can edit and save the thresholds. Or, you can uncheck the «Enable this alarm» checkbox under the General tab.
I would recommend leaving it enabled but maybe change the alarm to 85 or 90% rather than the defaults.
The difference between thick and thin is fairly straightforward. Thick disks take up the entire allotment right away — it’s reserved space for the VM. Thin essentially tricks the VM into thinking that it has all of the available space, but it only actually takes up what it needs on the datastore. The basic difference between Eager and Lazy zero provisioning is a slight performance increase (mostly negligible) for eager provisioned datastores because 0s are written up-front across the disk. Most people recommend thin provisioning as a default. I personally like to thick provision disks for things like logs and databases that can easily fill up if something goes wrong within the operating system of the VM. Doing this can prevent you from having issues down the road when a thin disk unexpectedly and quickly fills up an over-provisioned datastore. It’s a little bit more of a conservative approach, and might not be necessary.